TITANIC DATASET
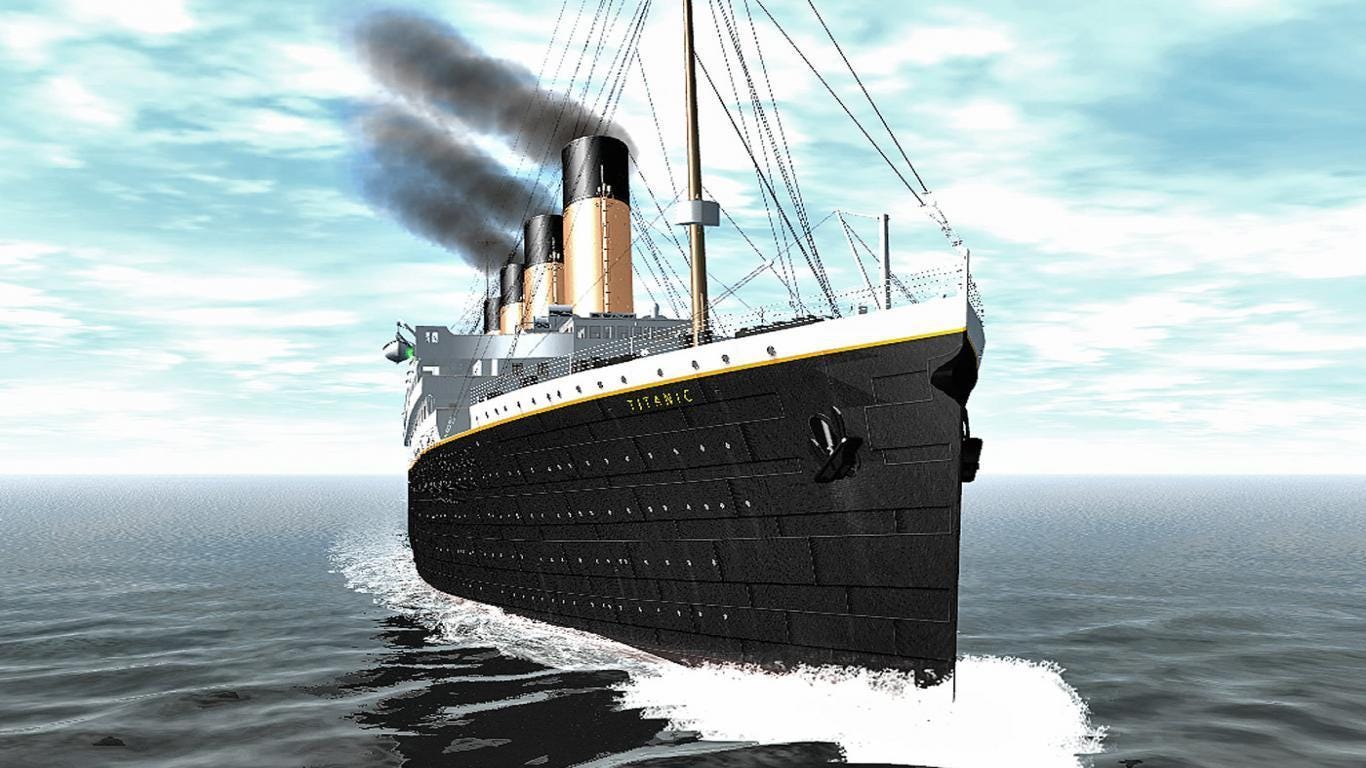
The sinking of the RMS Titanic is one of the most infamous shipwrecks in history. On April 15, 1912, the Titanic sank after colliding with an iceberg, killing 1502 out of 2224 passengers and crew. This sensational tragedy shocked the international community and led to better safety regulations for ships.
One of the reasons that the shipwreck led to such loss of life was that there were not enough lifeboats for the passengers and crew. Although there was some element of luck involved in surviving the sinking, some groups of people were more likely to survive than others, such as women, children, and the upper-class.
‘My goal is to apply the tools of machine learning to predict which passengers survived from the tragedy.And what factors made the passengers more likely to survive in the sinking of titanic’
The following are the steps to follow
- Data Set overview
- Importing the data set
- Exploratory Data Analysis
- Data preprocessing
- modeling
- prediction
- Dataset overview
Source: https://www.kaggle.com/c/titanic/data
The dataset consists of 891 rows and 12 columns .
- PassengerId
- Survived
- Pclass
- Name
- Sex
- age
- Sib Sp
- Parch
- Ticket
- Fare
- Cabin
- Embarked
2. Importing the dataset
Let’s import a bunch of libraries before importing the dataset. Pandas is used use to load the data,mat-plot library and seaborn for visualization.
import pandas as pd
import matplotlib.pyplot as plt
import seaborn as sns #library for statistical plotting
import numpy as np
%matplotlib inline
import math
Pandas is used use to load the data,mat-plot library and seaborn are used for plotting and visualization.
Loading the Dataset
we import the dataset and store in pandas dataframe called data .

Let’s get some basic information about the data. The .shape method tells us the number of rows and columns in the dataframe.

In the above we can see that our data set contains 891 rows and 12 columns.
We can learn more information about data using .head(), .info(), and .describe().

Let’s see total number of passengers in the dataset by using len() function.

Exploratory Data analysis
Exploratory Data Analysis: Exploratory data analysis (EDA) is an approach to analyzing data sets to summarize their main characteristics, often with visual methods. A statistical model can be used or not, but primarily EDA is for seeing what the data can tell us beyond the formal modeling or hypothesis testing task.
Here in this dataset we have 12 features or columns , our goal is to predict survived passengers. so, we will plot a count plot comparing each feature or column with Survived feature or column . For count plot we make use of seaborn library.

From the above count plot we can see that Female survived rate is high compared to male.

From the above diagram we understand that the passengers in 3rd class has low survival rate compared to 1st and 2nd classes.
Data Preprocessing.
In data preprocessing we will transform the raw data into understandable format by handling the non zero values(NAN) and missing values.It is also called data wrangling or data cleaning.
Let’s the is there are any null values by using isnull().sum() function.This will give the count of null values in each column.

From the above code we can see that NAN values are there only in two columns(age,cabin).now, we have the handle the null values in two ways.One is by replacing them with the means of that particular column.second is dropping that column having NAN .

To drop the column we simple use .drop() function.In the above diagram we can see that the there is no Cabin column.
Since there is text data in some columns we will convert the text data into numerical data.

In the above diagram we can see that the text column Sex is replaced with male. 0 value in male column represents Female and 1 represents male.In the same way we will replace the Embarked column and Pclass.


Now we will concatenate the new columns into the data set.


now drop the columns ,name, Sex, ticket,Pclass because they are not useful anymore.

Training and Testing the data
we will split the data into test subset and train subset. Here we need to define the depent and independent variables.Next step is to split the data into training and testing subset,for that we will be using sklearn.

Modeling
Logistic regression
Now we will train the model on train data.

Predictions
we make predictions on the model using X_test.To measure the performance of the model we will use performance metrics such as accuracy,confusion matrix,classification report.For performance measure we use test data called y-test.

We can see the accuracy of the model is almost 78% .
Lets see how the K-NN Works for this data set.

From the above diagram we see that accuracy of k-NN is 0.629
we can observe that logistic regression is preforming well compared to K-NN algorithm.
Conclusion
From this data set, we built a model which gives minimum miss-classified data points.With this model we can predict ,whether the person is survived or died.